Developed with graziers, Farming Forecaster places soil moisture, local weather, pasture production and livestock performance information graziers fingertips. This video provides a brief overview of what Farming Forecaster is all about.
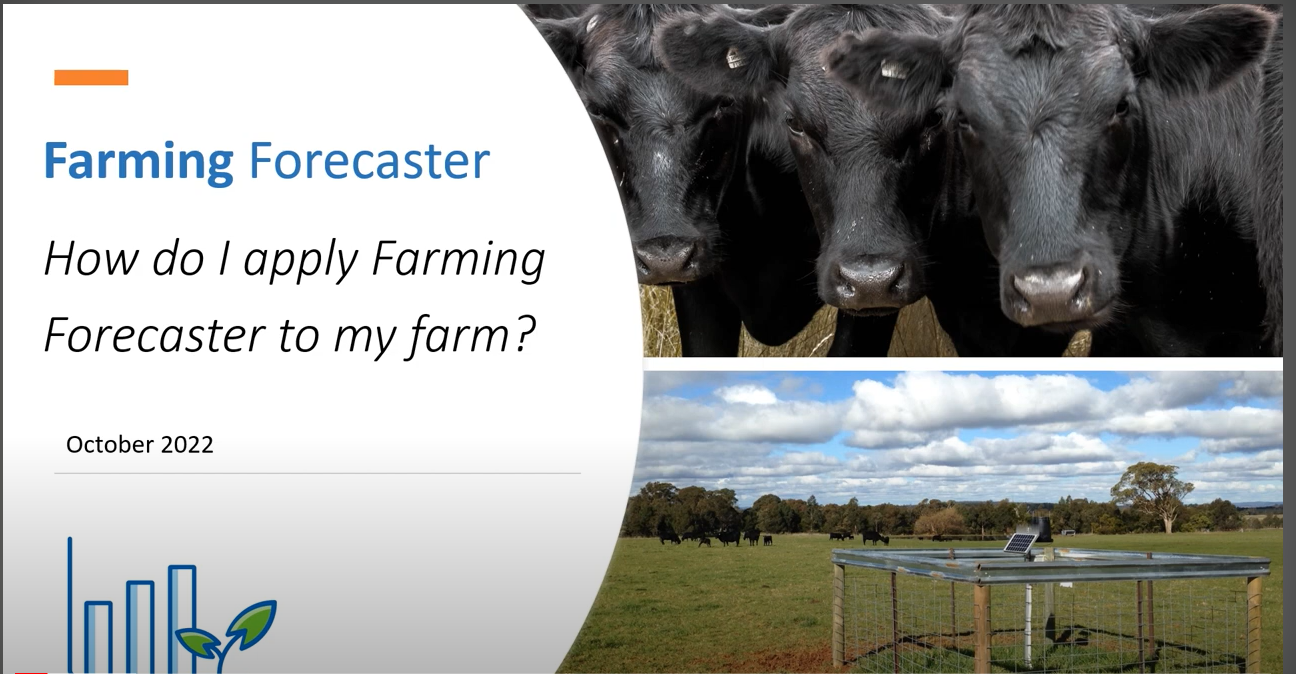
Introduction to Farming Forecaster
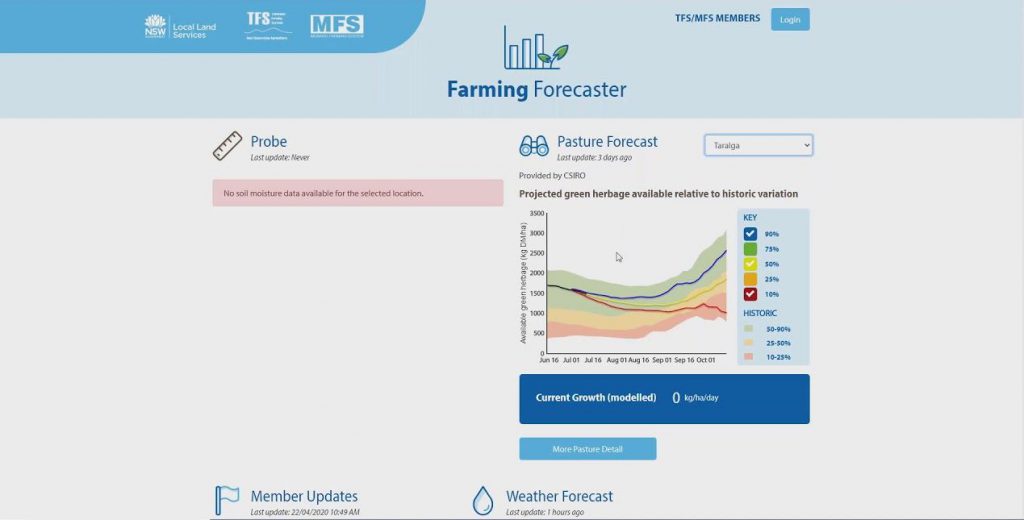
Farming Forecaster is a decision support tool that helps producers assess current seasonal conditions and the likely range in pasture availability and livestock performance during the next 3-4 months.
This video provides a basic overview of Farming Forecaster, including how to access the tool and general layout of information.
Making sense of the probe data
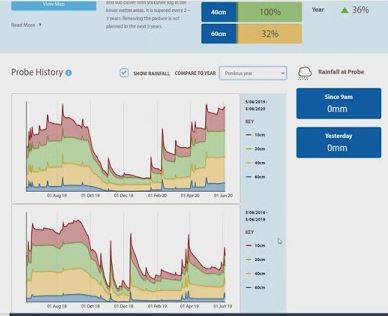
This video takes a close look at the ‘probe’ data – a key feature of the Farming Forecaster tool. Detailed explanation is provided around how to read and interpret the various outputs including soil moisture percentage readings, the ‘Probe History’ graph, rainfall and soil temperature. The video also shows how to access information about the soil type at each probe location. Soil type is an important factor to consider when viewing the information.
Making sense of the probe data (Part 2)
This video takes a close look at the ‘probe’ data – a key feature of the Farming Forecaster tool. Detailed explanation is provided around how to read and interpret the various outputs including soil moisture percentage readings, the ‘Probe History’ graph, rainfall and soil temperature. The video also shows how to access information about the soil type at each probe location. Soil type is an important factor to consider when viewing the information.
Making sense of the pasture forecast
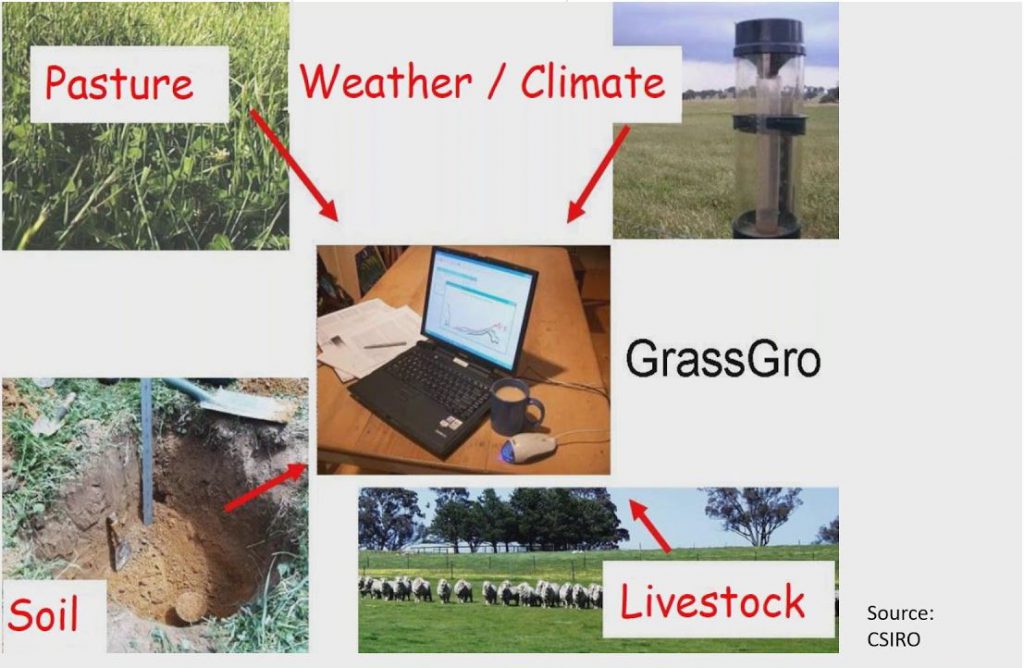
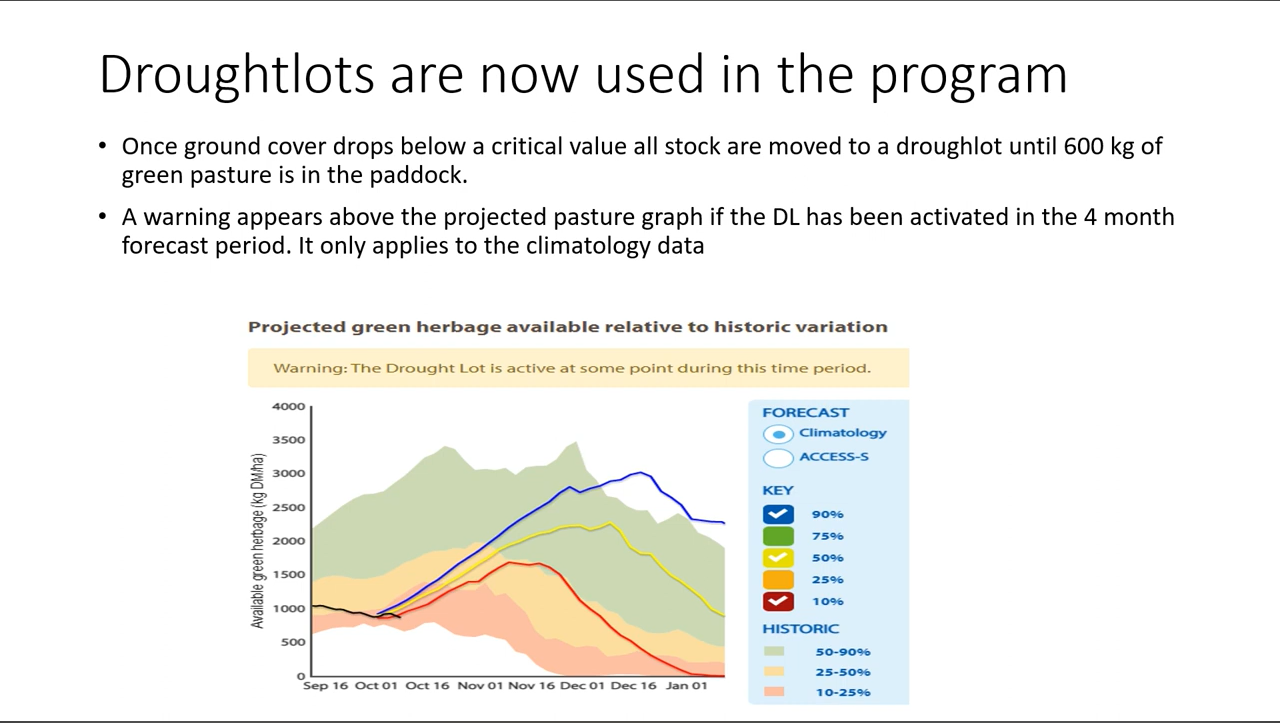
Produced by GrassGro, the pasture forecast provides information around current pasture position and the likely range in pasture availability over the next 3-4 months. This video explains how to access the pasture forecast for each location, what information and data is used to generate the forecast and how to read and interpret the pasture forecast graph. During the video we also take a look at some of the other graphs that appear on farming forecaster, including the Plant Available Water graph and the Ground Cover graph.
Making sense of the pasture forecast (Part 2)
Produced by GrassGro, the pasture forecast provides information around current pasture position and the likely range in pasture availability over the next 3-4 months. This video explains how to access the pasture forecast for each location, what information and data is used to generate the forecast and how to read and interpret the pasture forecast graph. During the video we also take a look at some of the other graphs that appear on farming forecaster, including the Plant Available Water graph and the Ground Cover graph.